Pie chart components
Simple helpers around go Pie component.
Pie chart
Helper method to create a pie chart.
Attributes are:
labels: column on which we want to perform an aggregationvalues: numerical values that will be aggregatedcustomdata: list of str that represent a text we want to use in the hovertemplatehovertemplate: str that must be formatted like html, that will show when you hover on the graphcolors: list of custom colors to be applied to the pie chart. Plotly default colors will be applied if not filled intext_threshold: float between 0 and 1, that controls the minimum threshold in terms of percentage of the total under which category labels will be shown. The higher the threshold, the less categories will be shown (only the biggest one),annotation_text: text that will be displayed at the center of the pie chart
Rendering:
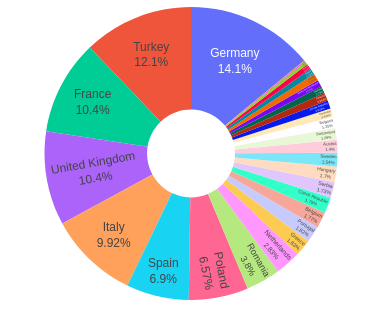
An example of such a component in a dash application