Map
Map
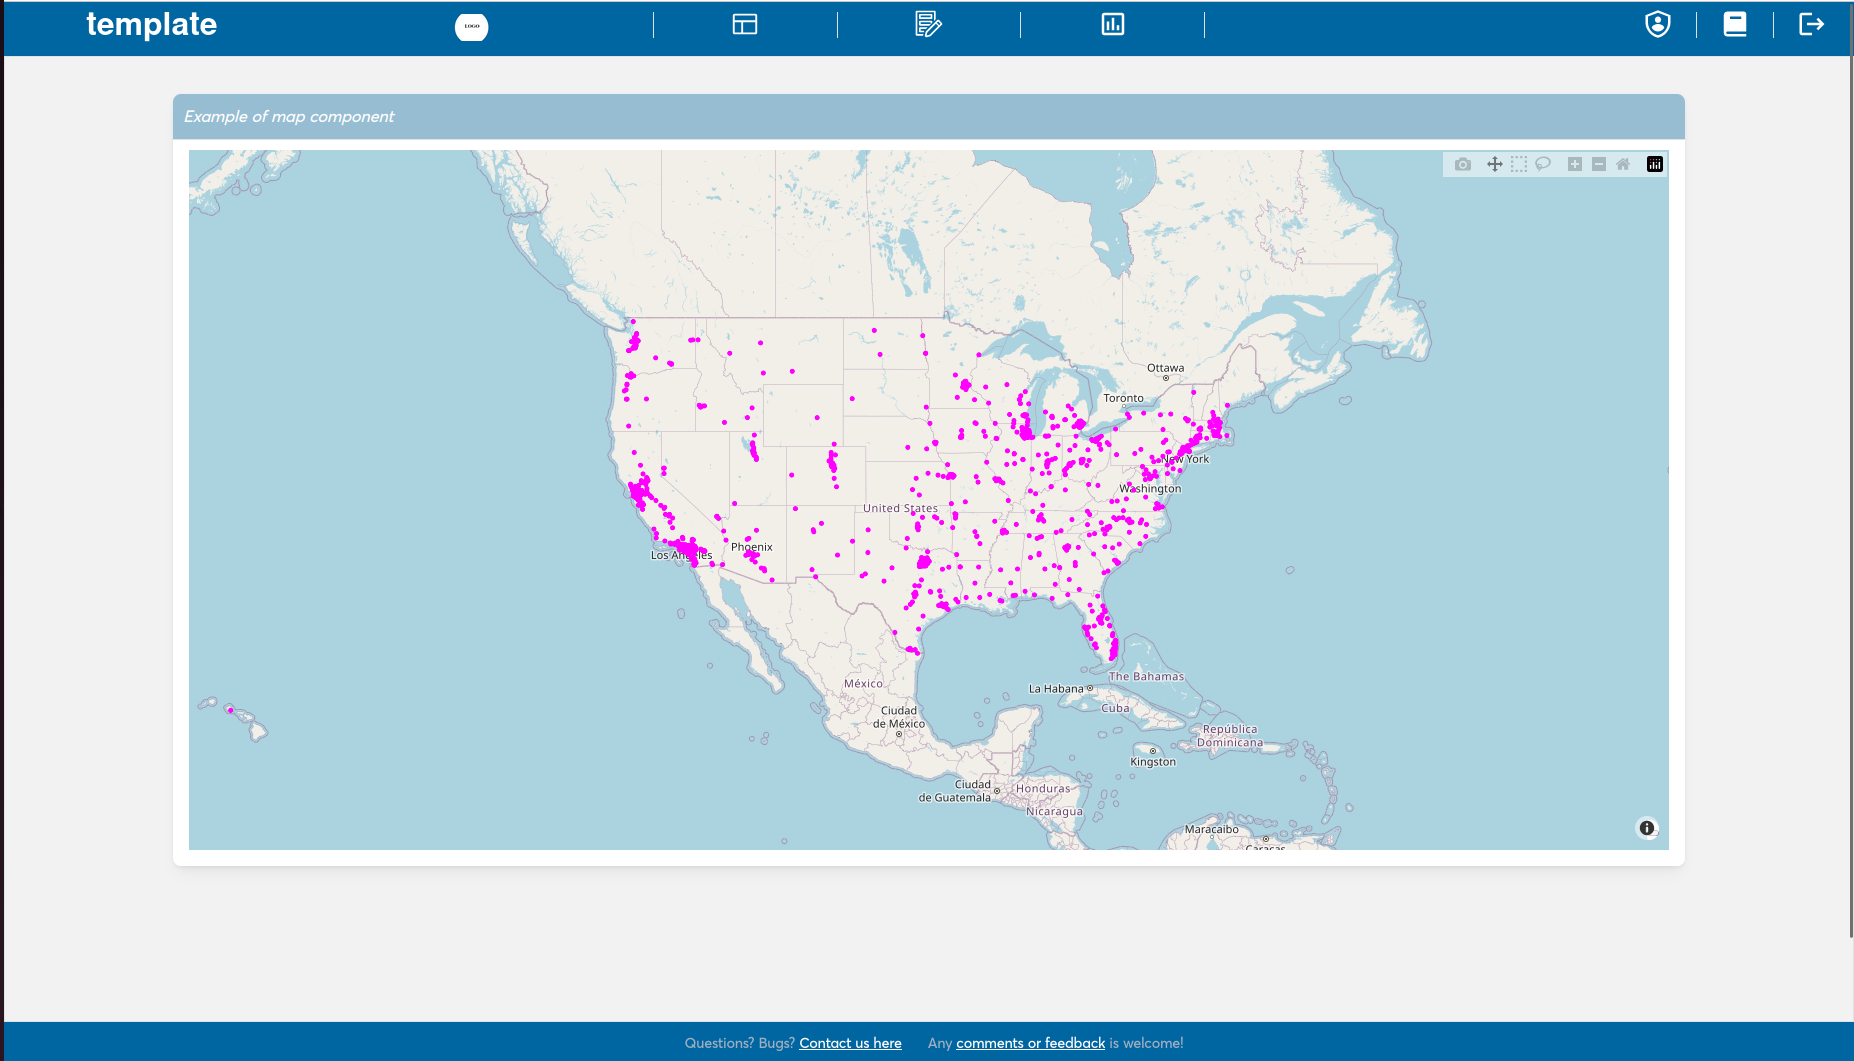
Simple page illustrating how to create a map.
Code cannot get more self-explanatory than that 😋
import pandas as pd
from dash import dcc
from plotly import express as px

US_CITIES_URL = 'https://raw.githubusercontent.com/plotly/datasets/master/us-cities-top-1k.csv'
MAP = 'map'


def get_map():
    """
    map example (using plotly)
    """
    fig = px.scatter_mapbox(
        pd.read_csv(US_CITIES_URL),
        lat='lat',
        lon='lon',
        hover_name='City',
        hover_data=['State', 'Population'],
        color_discrete_sequence=['fuchsia'],
        zoom=3,
        height=700,
        width=1480,
    )
    fig.update_layout(mapbox_style='open-street-map')
    fig.update_layout(margin={'r': 0, 't': 0, 'l': 0, 'b': 0})
    fig.show()
    return fig


MAP_GRAPH = dcc.Graph(figure=get_map(), className='graph', id=MAP, style={'padding-top': '10px'})